Only with quantum theory atomic structure can be understood. Quantum theory is, so to say, the mathematical formulation of particle–wave duality. While we cannot dive into mathematical details here, the basic principles shall be sketched.
Waves always have some spatial extension, while one may imagine the elementary, indivisible particles as being “pointlike”. The fact that these apparently contradictory attributes are compatible in matter waves and also in light (photons) is hard to understand, but all experimental data point out that this is the case.
Thus the electrons bound by electric force to an atomic nucleus (which contains almost all of the atom's mass) must be considered to be waves. Wavefunctions are used to calculate observable quantities; in particular, the probability to find the (pointlike) particle in some volume is given by the squared value of the wavefunction integrated over the volume.
The hydrogen atom is the simplest of all atoms. Its nucleus carries one unit of positive elementary charge and thus binds only one electron to it. Its possible wavefunctions can be obtained as solutions of the Schrödinger equation. This is described in detail in all textbooks on quantum mechanics. For us it is important to realize that the electron forms some kind of standing wave. Some simple examples will be used to demonstrate general properties of oscillating systems, standing waves in particular.
The exact way how a guitar's string vibrates depends on the spot where it has been plucked. It is always possible to describe the motion of the string as a superposition of simple modes which have the peculiar property that all parts of the string move sinusoidally with the same frequency and phase. These are called normal modes or eigenmodes. The superposition of different normal modes is heard as superposition of ground- and overtones.
The picture below shows how a string vibrates in the lowest three normal modes. The motion is so fast that it cannot be resolved by the eye, one sees a sequence of nodes and antinodes.


Important properties of three-dimensional waves cannot be seen on strings; vibrating membranes show somewhat more. Instead of nodes the normal modes exhibit nodal lines. In the case of vibrating metal plates, the nodal lines are known from classroom demonstrations as Chladni figures.
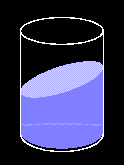
Water waves are more difficult to describe than those which we are interested in. If we restrict the considerations to small amplitudes, we may neglect that. Water waves have the advantage to be slow and the wave motion can clearly be seen. The following pictures are idealized and in slow motion.
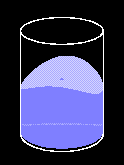
In the simplest mode in a glass of water, which can easily be excited, the liquid is swashing to and fro. This can happen in an arbitrary direction and therefore there are infinitely many standing waves of that kind, all with the same oscillation frequency.

| (a) | (b) | (c) | (d) |
Double-clicking one of the images will switch on the animation; a single click switches it off again. If you click on the letters below the pictures, the animation appears in a separate window.
The mode of figure (e) can be excited by falling drops. It has rotational symmetry and therefore there is no other possible orientation. The mode (f) may be obtained by gently shaking the glass with the right frequency; again different directions of motion are possible, and, similar to the above, there are two linearly independent modes, the superposition of which will yield all the others, in particular also waves going round clockwise or counterclockwise (g). The dark spot in the middle of the surface indicates that this point does not move.
To illustrate the matter waves of the electron in an hydrogen atom, the square of the local amplitude is plotted. This quantity is identical with the particle density, and this cloudy density distribution is plotted as a white mist over a dark background. Each of the clouds shown contains exactly the one electron of the hydrogen atom, even if it consists of several distinct parts.
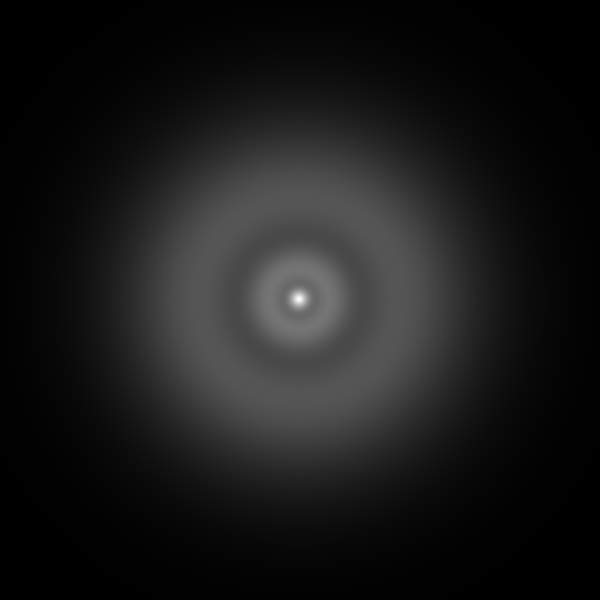
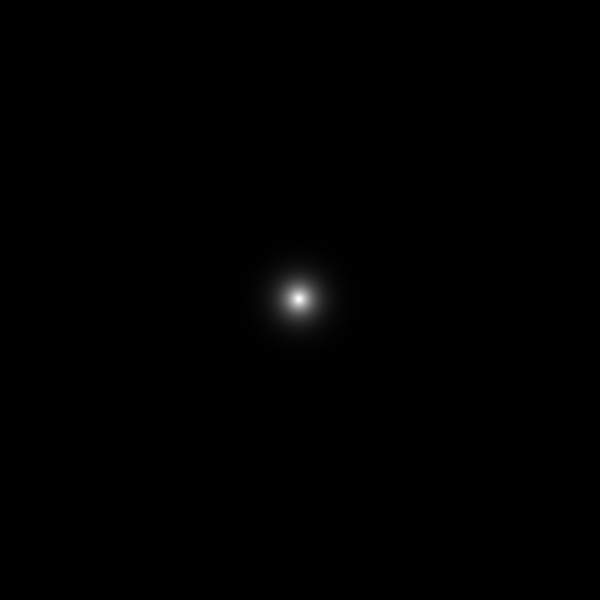 1s |
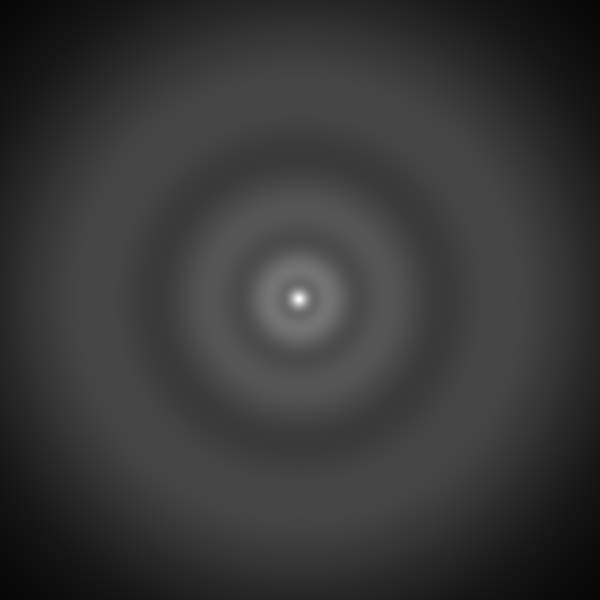
The state with lowest energy is spherically symmetric without any nodes. The electron is very close to the nucleus. Scale: The width of this and the following pictures is sixty times the Bohr radius, i.e. 3.17 nm. |
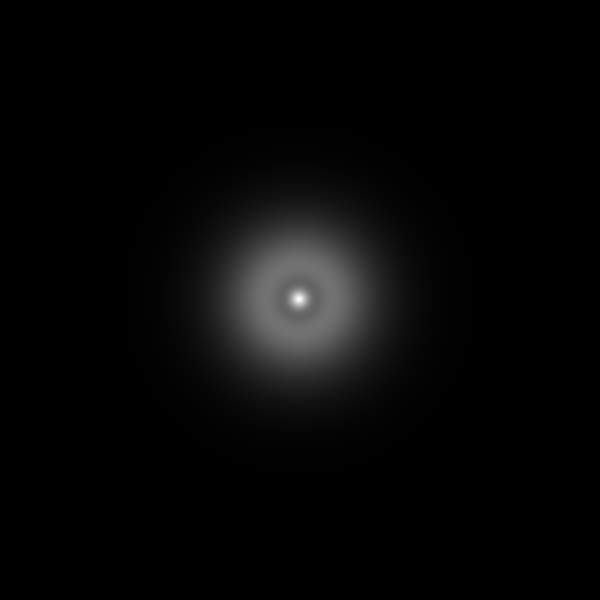 2s |
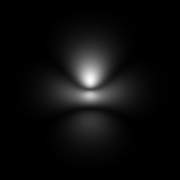
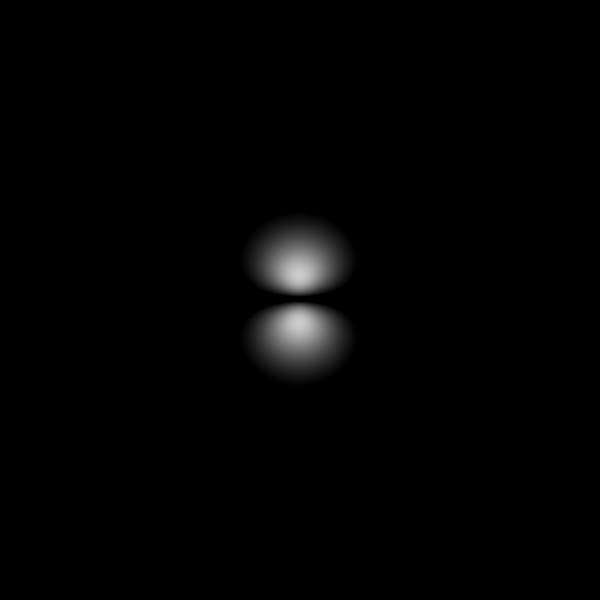 2p | For the next higher possible energy, two states of different shape are possible. One of them is spherically symmetric and has a spherical nodal area (left), the other is rotationally symmetric around a symmetry axis. The symmetry axis is vertical in the right picture, but it may have any orientation in space. Each one of these infinitely many functions may be written as a superposition (linear combination) of three basis functions, the symmetry axes of which are conveniently chosen along the coordinate axes. |
 3s |
 3p |
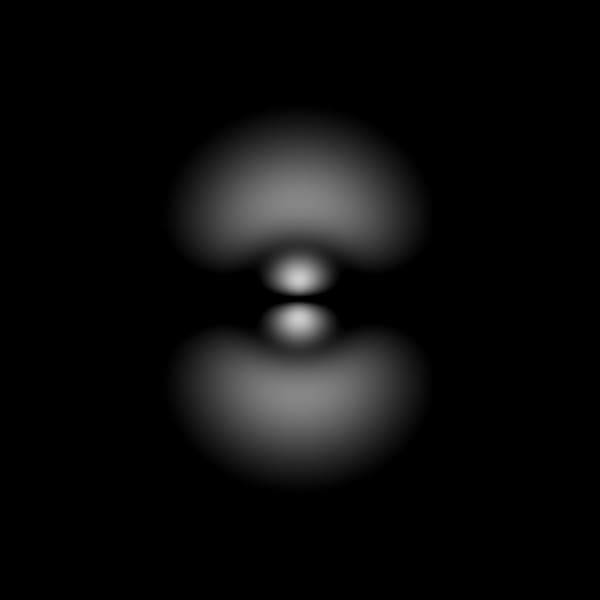
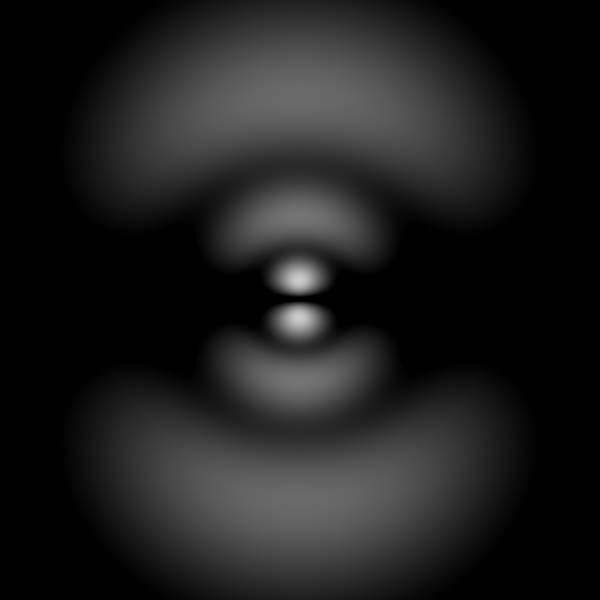
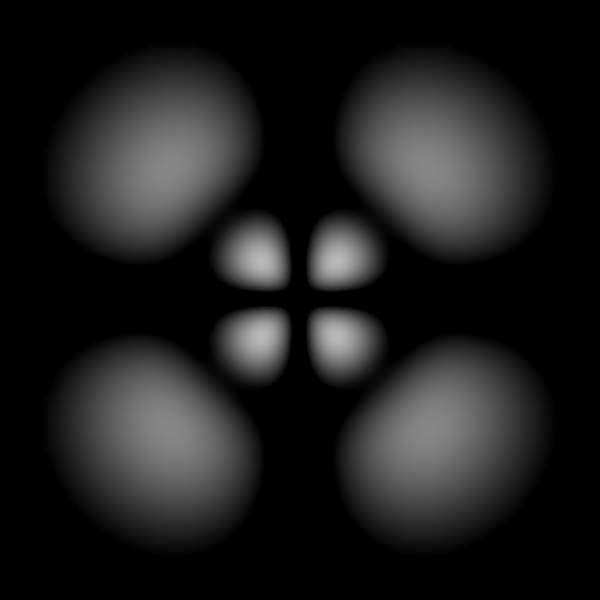
 3d |
Assume that the center of force is the origin, the x-axis is perpendicular to the plane of the screen and pointing outwards, the y-axis points to the right and the z-axis upwards.
It is easy to figure out six different 3d electron clouds in special orientations in the coordinate system chosen. In the picture shown above, the maxima of the density are in the y-z-plane, and the x-y and x-z planes are nodal planes.
If the cloud is rotated by 90º around the z-axis, the maxima are located in the z-x-plane – this is the second simple special orientation, and the third one is that where the maxima are in the x-y-plane.
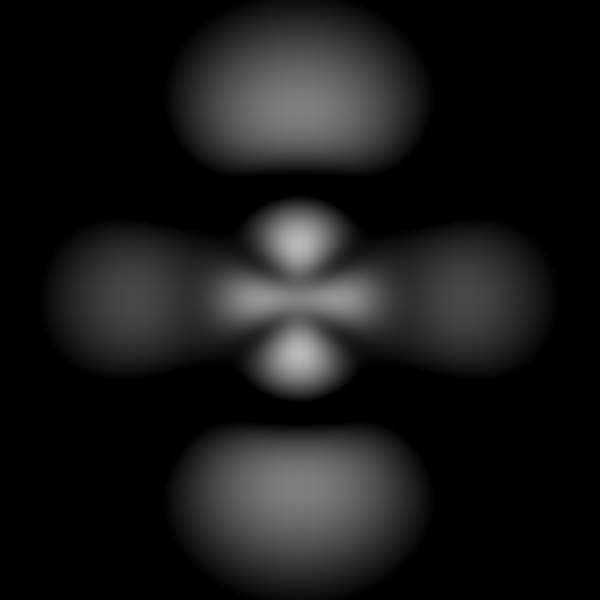
 | Next we assume the 3d-cloud of the figure above to be rotated by 45º around the x-axis. This yields the density distribution shown to the left. Here the maxima of the density lie on the coordinate axes in the y-z-plane. Two more states again result from rotations by 90º around the z- and y-axis, respectively. |

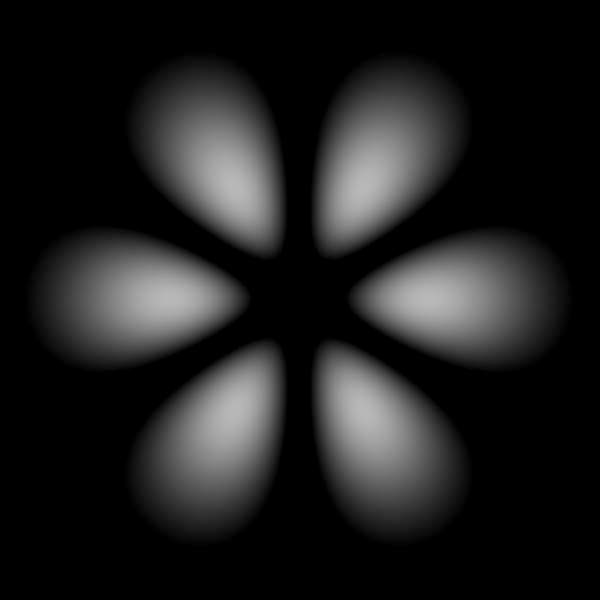
3d (m=0) | Instead of the three functions written above one usually choses the last one and the difference of the first two lines (divided by the squareroot of 3). The corresponding density distribution is shown at the left; it is rotationally symmetric around the vertical z-axis. |
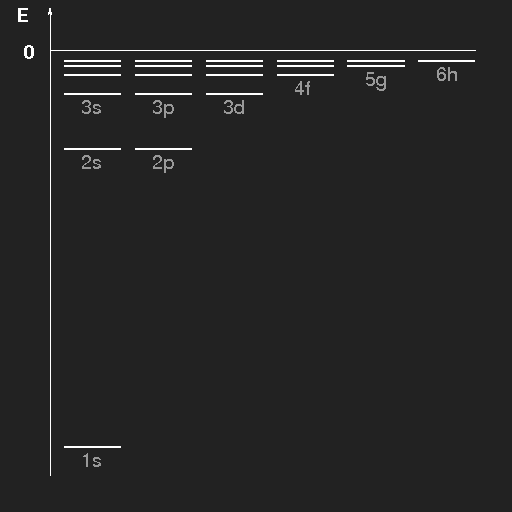 | Energy level scheme of the hydrogen atom. The levels have been drawn separately for the different values of (orbital) angular momentum and are labelled by the principal quantum number n and the azimuthal quantum number, where the letters s, p, d, f, g, h stand for l = 0, 1, 2, 3, 4, 5, respectively. |
Transitions from lower to higher states can occur if the necessary energy is supplied by an electromagnetic wave or by a collision with an other particle (if the temperature is high enough), and vice versa transitions from higher to lower states can occur through emission of radiation or in collisions with other atoms or molecules. The emitted photons carry the energy difference between initial and final state of the atom. For photons, the basic quantum mechanical relation between energy and frequency ν holds (h is the Planck constant):
Starting from the Schrödinger equation we have obtained the emission spectrum of the hydrogen atom. Historically, the path towards knowledge was worked through in the opposite direction.
Some remarks on matter waves: we have used the analogy with water waves and other mechanical oscillations to make their properties plausible. But – until now nothing has been seen of any wavy motion! Indeed there really is no motion in states of fixed energy, such states are “stationary”.
This is due to the peculiar quantum mechanical time dependence: instead of being like cos(ωt + φ) it is described by ei (ωt + φ) (with ω = 2πν = 2πE/h).
But if there is a mixture of states with different energies (and thus different frequencies), there is real time dependence. An example is given in the following slow motion pictures:
|
3d |
 Superposition of 2p and 3d |
2p |
In times of the old Bohr Theory of Quanta, the transition from one energy eigenstate to an other one has been called “quantum leap”, this notion has even found its way into colloquial language (at least in German). However, the conception of leaps is not necessary. Though it is not possible to observe such a transition in detail – it is an appealing idea that the initial state continuously changes into the final one, while the electric charge oscillates and emits (or absorbs) an electromagnetic wave.
After hydrogen, the helium atom is the next simplest atom. Its nucleus carries two units of positive electric charge and binds two electrons. An exact analytical solution of the Schrödinger equation is no longer possible, one has to use approximate or numerical methods.
In an approximate treatment of atoms with more than one electron one replaces the interaction between electrons by a static potential. At large distance from the nucleus, an electron “feels” attraction by the nucleus and repulsion by the other electrons which screens the attraction. The closer the electron comes to the nucleus, the weaker is this screening. The effective potential for an electron in a neutral atom approaches the Coulomb potential of a single elementary charge for large distances, while for very small distances, that of the full nuclear charge.
The change of the potential affects the shape of the wave functions and the resulting density distributions (electron clouds), but the general appearance is not changed, in particular the symmetries and the ordering of nodal surfaces remain the same.
|
1s |
Here, the density distributions of the electron in some selected modes of the hydrogen atom are shown once more; all in the same scale (the width of each picture is 3.17 nm). | ||
|
2s |
2p |
|
3s |
3p |
3d |
3d (m=0) | ||
 4s |
 4p |
 4d |
 4d (m=0) |
 4f |
 4f (m=0) |
It is a peculiarity of the Coulomb potential that states with the same principal, but different azimuthal quantum numbers have the same energy. If the effective potential is close to that of a single elementary charge at large radii, but more attractive near the nucleus, then electrons in s-states will “feel” this most strongly, as the density has its maximum just at the nucleus. Of all the states with the same principal quantum number n, those with l = 0 are lowered in energy more than those with l = 1, these more than those with l = 2 and so on, for the larger l is, the larger is the distance of the electron clouds to the nucleus, as can be seen in the pictures above.
Now our preliminary definition of the principal quantum number as the number of the energy level is no longer true. Denoting by nr the number of spherical nodal surfaces, by l the azimuthal (orbital angular momentum) quantum number, then n can be defined as
and then n and l can be used to label the states as before.
In the ground state of the helium atom, both electrons occupy the lowest possible single particle level 1s, this is denoted by 1s2.
One might expect that in the lithium atom (the nucleus of which has three units of positive charge) the electron configuration is 1s3. But this is not the case. What one has learned from the optical spectra is, that only two electrons may be in the lowest single particle state, the next one must be content with the next higher one which is the 2s state. Thus the electron configuration of Lithium is 1s22s.
The periodic system of elements can only be explained if one assumes that every single particle mode characterized by the two quantum numbers n and l and its orientation in space can only be taken on by two electrons. These two electrons must differ in an other property characterized by one more quantum number (the spin quantum number) which can only take two values, 1/2 or –1/2. This is a special case of the more general Pauli principle (Wolfgang Pauli 1924) which says that the states of two electrons (at the same place) never can be identical in all quantum numbers.
Therefore it is important to know how many independent orientations are possible for a given shape of a mode. The s-waves are spherically symmetric, thus there is only one s-wave for every principal quantum number. We have seen that a p-wave in an arbitrary direction can always be written as a superposition of three independent basis functions, thus there are three independent p-waves for each n, which can be chosen along the coordinate axes. For the d-waves (l=2), we have seen that there are five independent functions, and it generally holds that for each value of l there are 2l+1 independent possible orientations, which for free atoms usually are labelled by the magnetic quantum number ml which can take on integer values from –l to l.
Considering a nucleus with multiple charge Z and “filling in” electrons successively in the lowest possible state (as allowed by the Pauli principle), the following sequence is obtained:
The levels written in brackets are very close in energy, with the consequence that, when electrons are successively added, the second level in the bracket gets some occupation already before the first one is completely filled.
As an example the electron configuration of molybdenum:
Hydrogen is a colourless gas; under “normal” circumstances the atoms are bound in pairs to H2-molecules and nothing can be seen of the possibility that light may be absorbed or emitted. Air (mainly nitrogen and oxygen) and the noble gases are colourless, and the same holds for many other substances. To observe emission of light or even spectral lines, one has to supply energy to excite the atoms.
In a gas discharge tube, the molecules are broken by collisions with electrons and ions, atoms are excited or even ionized by collisions, and then emission of light as well as absorption can be observed.
High temperatures have the same effect: in the sun there is atomic hydrogen in excited states, and in the solar spectrum the absorption lines of hydrogen can be seen.
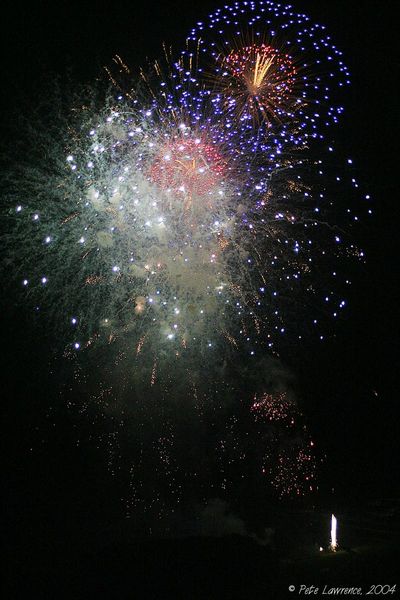
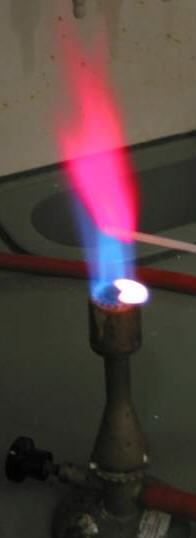
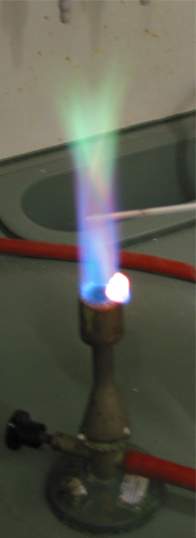
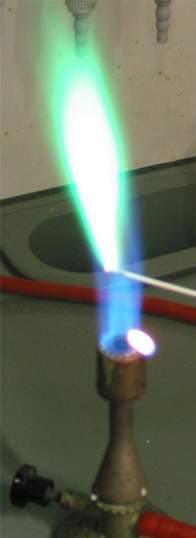
The temperature of the flame of a Bunsen burner is sufficiently high to split molecules and to ionize atoms which after recombination give off their energy by emission of photons. With traces of alkali metal or alkaline earth metal ions (and other substances as well) flames can be coloured; this is used in pyrotechnics and also for quick tests on these substances in minerals etc., see e.g the Wikipedia “Flame test”.
|
|
|
|
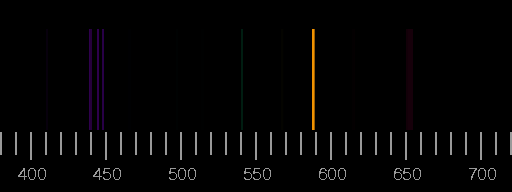
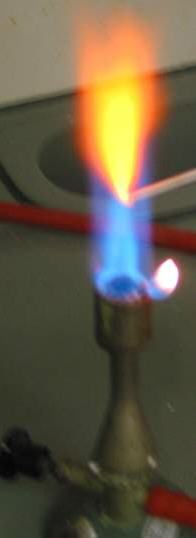 | ||||||||||||||||
| Lithium | Boron | Copper | Calcium |
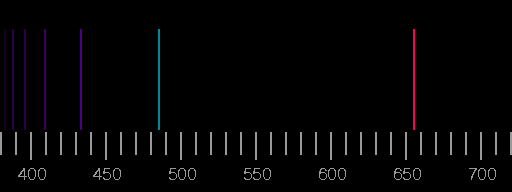
The spectra which, after the one of hydrogen, are the simplest to explain, are those of the alkali metals. These atoms have a single, relatively weakly bound electron in the outermost shell in addition to the spherical, noble-gas like core. The transitions of the outer electron from the low lying excited states to the ground state produce the visible part of the spectrum.
The sodium spectrum is dominated by a line of 589 nm wavelength, coming from the transition from the 3p state to the 3s state. (In fact, due to fine structure splitting of the p state, which has not been dealt with here, this line is actually a doublet, i.e. two very closely neighbouring lines.)
)
) .
Right: Photo: Imac Vincent, May 14, 2008. (
source) .
.
Right: Photo: Imac Vincent, May 14, 2008. (
source) .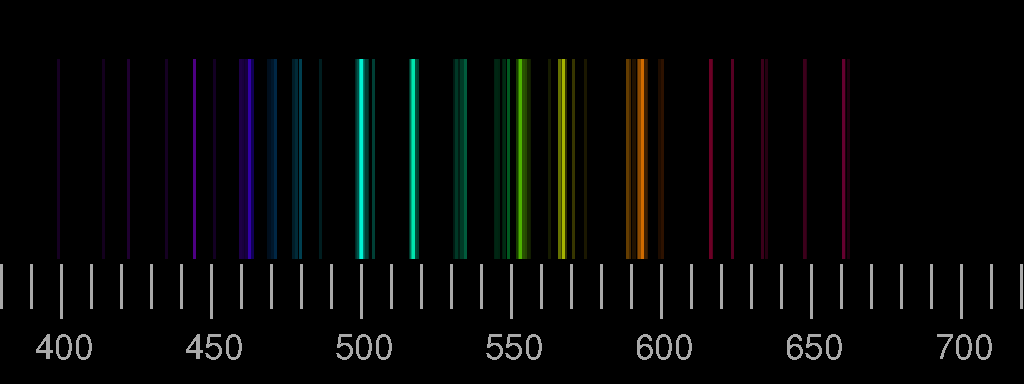
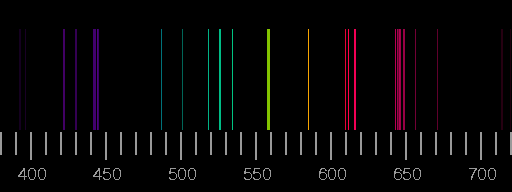
Top: Spectrum of nitrogen. Bottom: Spectrum of oxygen. Scale: wavelengths in nm. The images are derived from the Saha-LTE (local thermodynamic equilibrium) Spectra provided by the NIST Atomic Spectra Database with the parameters temperature 12 eV, electron density 2.0×1022 cm−3.
Real spectra may differ considerably from these synthesized ones in that lines shown here are not seen there or that lines occur which are not included in the above pictures. See the lightning spectrum as an example.
The relative intensities of the lines depend on the circumstances of excitation and de-excitation of the atoms and ions and emission and possible re-absorption of the photons. Assuming a thin plasma sheet in thermodynamic equilibrium, only temperature and electron density are important. But not so in most other cases.
)
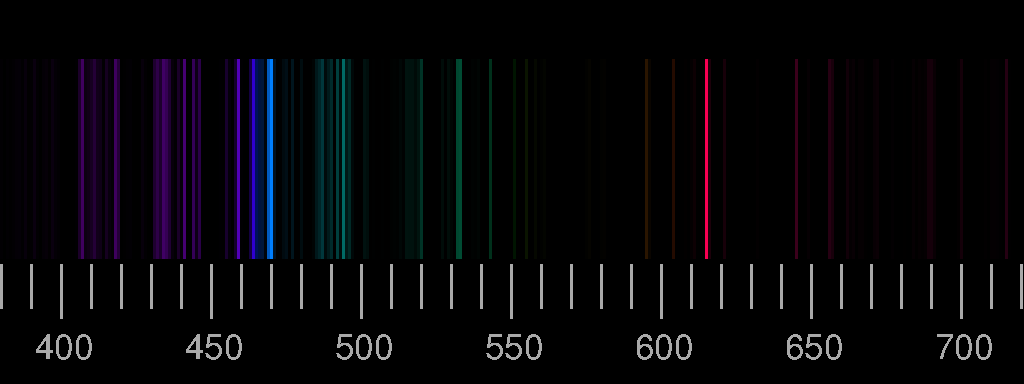
An electric spark in air produced with a small Wimshurst machine, photographed through a diffraction grating. There is a continuous background due to photon emission by unbound electrons when captured by ions.
The violet lines are blue in the picture, and the yellow and orange lines of nitrogen show up green and red instead. Spectral colours cannot be reproduced faithfully in photography. This has been discussed already in connection with experiments with the prism. Click on the above spectrum to see an image which has been processed to make it somewhat more similar to the visual impression!
The four 2p-electrons may be distributed over six possible single-particle states. If there were no interaction between the electrons, all the fifteen possibilities would lead to the same energy. But due to their charge, the electrons repel each other.
electrons with parallel spins tend to avoid each other due to the Paiuli principle. Thus, parallel spins are energetically favoured. The larger the total orbital angular momentum, the less is the mutual overlap of the electron densities. This leads to a level splitting according to total orbital angular momentum (“gross structure”). In addition, there is an interaction between orbital and spin-angular momentum, leading to additional splitting according to total angular momentum (“fine structure”). For the lighter elements, spin-orbit interaction is only small. As long as there is no preferred direction in space, total angular momentum is conserved and the states can be labelled by its quantum numbers.
Usually total angular momentum is denoted by capital letters S, P, D, F . . . standing for L=0, 1, 2, 3 . . respectively. Spin is given as a left upper index (2S+1).
Thus the lowest few levels of oxygen are the following (experimental data taken from the compilation of
Sansonetti und Martin):
| Configuration | Term | J | Level (cm−1) |
| 1s2 2s2 2p4 | 3P | 2 | 0.000 |
| 1 | 158.265 | ||
| 0 | 226.977 | ||
| 1s2 2s2 2p4 | 1D | 2 | 15867.862 |
| 1s2 2s2 2p4 | 1S | 0 | 33792.583 |
| 1s2 2s2 2p3(4S)3s | 5S | 2 | 73768.200 |
| . . . |
For the transition 1S→1D one gets the wavelength of 558 nm – that is the green line, and for 1D→3P the wavelength is 630 nm, the red line of the aurora. But why are these lines not seen under laboratory conditions?
In the treatment of dyes emission and absorption probabilities are dealt with in some more detail. Large probabilities are only found in electric dipole transitions; transitions which occur much less frequent have been called “forbidden” since the early days of atomic spectroscopy, as often they are not observable at all.
In that sense, both transitions are “forbidden”. 1S→1D is an electric quadrupole transition, and in 1D→3P a spin-flip occurs.
As mentioned in the beginning, light emission from single atoms can be observed only seldom in nature. Lightnings and polar lights are the only prominent earthly examples, but if seen, they are impressive!
)
) . .
. .Currents of energetic charged particles are flowing at high altitude along the magnetic field lines (the single particles following coiled paths). They come closest to the ground at high latidudes. In collisions, energy is transferred to the particles of the upper atmosphere and is then radiated off as visible light. The polar light originates from heights between roughly 100 and 200 km; in times of strong solar activity also much higher, then it can be seen even at middle latitudes. The composition of the atmosphere at these heights is very different from that of the lower layers: nitrogen molecules and oxygen atoms are much more abundant than all the rest.
The red line of oxygen (630 nm) is dominant at high altitudes, but fades below 150 km, as the excited oxygen atoms in the 1D-state are de-excited by collisions with nitrogen molecules much faster than by radiation. The green colour of the aurora below 150 km height stems from the 558 nm line of Oxygen. It is not seen at larger heights since the 1S-state is not reached from the 3P ground state in collisions with electrons or protons. It is assumed that this state is produced in collisions of O(3P) with excited nitrogen molecules which give off their energy and take over angular momentum:
) .
.)
)
) | Far more often than in natural phenomena one can see artificially induced atomic emission – at least in the city. Here as an example a neon-filled gas discharge tube in front of a black wall is shown. (This and the next picture show exhibits of the “Universum® Science Centre” in Bremen.) |
) |
Plasma lamps, invented by Nicola Tesla, have been re-invented as decorative objects, plasma spheres or balls, by Bill Parker. They contain a rarefied noble gas or mixture of noble gases; the energy to excite the atoms is supplied by high frequency high voltage at the inner electrode (ca. 2 kV or more depending on the size, ca. 10–40 kHz). Typical gas pressures range from 2 to 10 Torr.
The ball shown to the left presumably contains a mixture of Neon and Xenon (95% Ne, 5% Xe ist customary), other mixtures produce streamers in different colours. |
It has already been mentioned that under normal terrestrial conditions only the noble gases consist of single atoms. All other elements have the tendency that their atoms bind to other ones, forming molecules, the energy of which is lower than that of the separate constituents.
In general, the charge distribution in a compound molecule of different atoms is not symmetric, an electric dipole moment results, the molecules attract each other and thus condense to a liquid or a solid.
Small molecules built from the lighter elements are colourless. As the free atoms, they cannot absorb visible light; only in the ultraviolet region the photons have sufficient energy to electronically excite the molecule. On the other hand, the vibrational excitations of the molecules lead to absorption and emission of infrared radiation and causes only very faint colour, as in water.
The large and strongly coloured molecules shall be treated in the special section “dyes”, another section is devoted to the colours of minerals and crystals.
Legal Information Data Privacy

)
)
)
)
)
)
)
)
)
)
)
)
)
)
)
)